After deploying personal website, Web Hotpot, the configurations can be seen in another blog Web Hotpot. I want to know the web perforamnce of the combination with nginx and nodejs.
Load test
Apache Jmeter is open source JAVA application to do load testing. Besides the official guide, The official guide about How to Building a Web Test Planis really helpful to start using Jemeter. Also we can learn to use it by watching Learning JMeter in 60 Minutes.
Prerequest: Be sure to have java installed first in your computer. Check if java is installed:
Windows,in cmd:
Linux:
if not recognized, install java first.
Download JMeter, then double-click $JMeter_home/bin/jmeter.bat to launch.
add users
- Right-click on Test Plan->
- Add->
- Thread(Users)->
- Thread Group
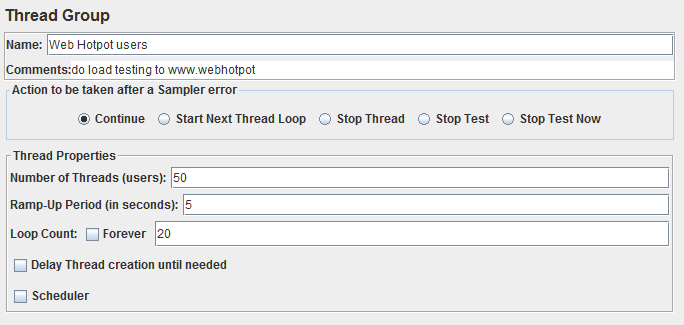
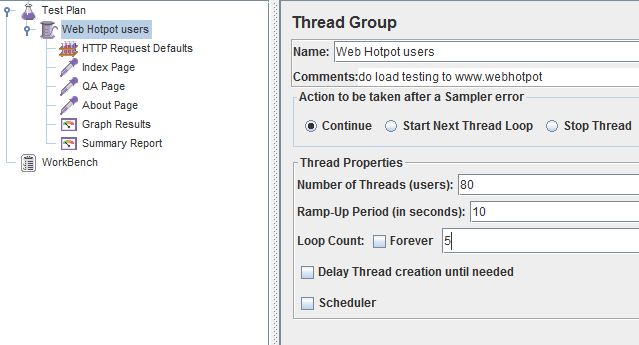
- Number of users: number of users JMeter will simulate
- Ramp-Up Period: how often users will send requests
For example,50 users in 5 seconds means 10 users request per second. - Loop: times to repeat the test.
It’s up to you whether to check the forever box.
java heap error and GC overhead limit exceeded: Once you start the test with large user numbers, you will notify that it will show test failed due to running out of java heap. I ran into the problem and here is several solutions:
I choose the way 4, in jmeter.bat
Running test on local machine, really really consume a lot of resources. I still not have enough heap space to support 100 user simulations.
add default HTTP requests and HTTP requests
Default HTTP request:
- select Thread Group, right click
- Add ->
- Config Element->
- HTTP Request Default
Keep it default if you will specify HTTP request.
HTTP request:
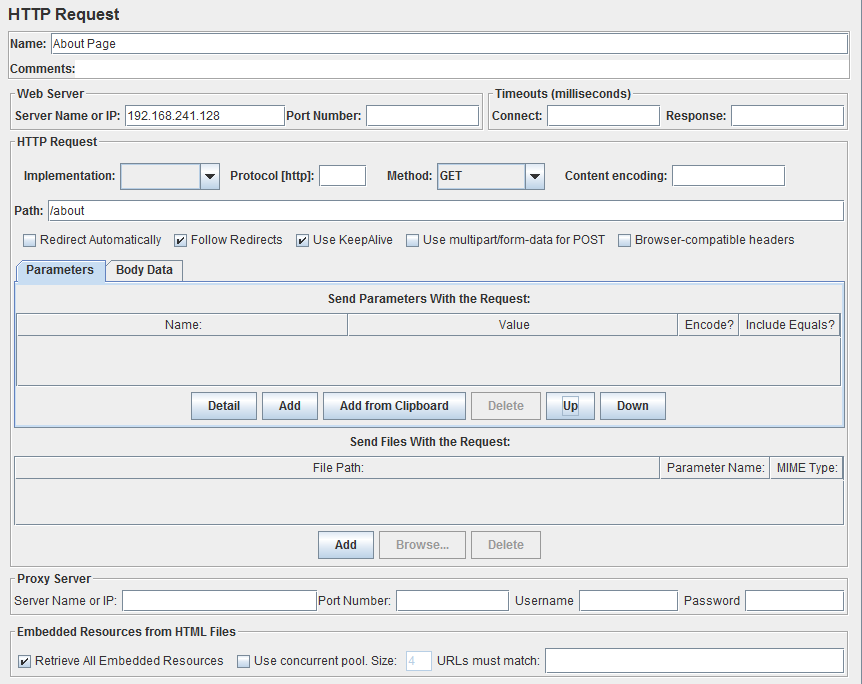
- Name: whatever..
- ServerName of IP: no ‘http://‘ and no ‘/‘ in the end
- Path: page path in your website
- Retrieve ALL Embeded Resources: I check this box to over test it. any JS, CSS, images etc will related to this page will be tested.
you can also set parameters in this session. We can mimic normal http request here.
add Listerners
- select Thread Group, right click
- Add->
- Listener
- Graph Result
- repeat 1~4, add View Results Tree
Monitor Server
There are many metrics worth to be monitored. I just list several of them.
- Request per seconds(RPS)
Spike of RPS can indicate increasing of customer activity or a DDoS attack. Drop of RPS may be the sign of network connection issues or lack of kind of resource such as CPU or RAM. - Response Time
Response time measures how quickly the requests are being handled. One of the most important application performance. - Response Code
HTTP response code know thhe health of the server and clients. - Server status
network usage, RAM usgae, CPU usage, disk usage - Active connections
hard limit on the total numbber on connections that the server can handle.
top
Ubuntu command. We can see the top progress, and monitoring the usage of CPU, RAM, etc.
nginx log
nginx log is located at /var/log/nginx/. The log format can be customized. We can add varibles provided by nginx, add into the log.
eg:
There are two modules related to monitoring the status of HTTP request
- ngx_http_status_module
This module provide more details about the HTPP status information, but only available in Nginx Plus. - ngx_http_stub_status_module
This module can only provide access to basic information status.
nginx status page:
- enable ngx_http_stub_status_module module.
check the if the module is enable1nginx -V 2>&1 | grep -o with-http_stub_status_module
If enabled, the terminal will show that:
add the following to the configuration of nginx,
/etc/nginx/sites-enabled/xxx123456location /status {stub_status on;access_log off;allow some_trust_IP_addreess;deny all;}nginx reload the config.
- type http://some_ip/status you will see a simple webpage showing that:1234Active connections: 1server accepts handled requests5443 5343 156541Reading: 0 Writing: 1 Waiting: 0
ngxtop
As its name, nginx+top. Ngxtop is a real-time metrics for nginx, written in python.
Installation:
more tools
There are more advanced tools to monitor the server, with friendly interface or with some specific requirement.
- nginx plus
- density server
- munin
- DynamicAPP
But they are not free.
Test report
80 users in 10 seconds, Loop 5. Each user will send three HTTP request for three different pages, all data trieved.
The server is in AWS EC2. The lowest configuration, ubuntu server with 1GB RAM.
Pre Status
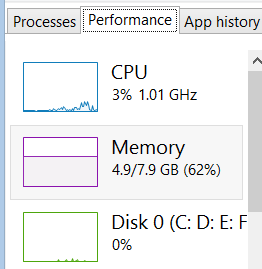
local machine:
Jmeter:
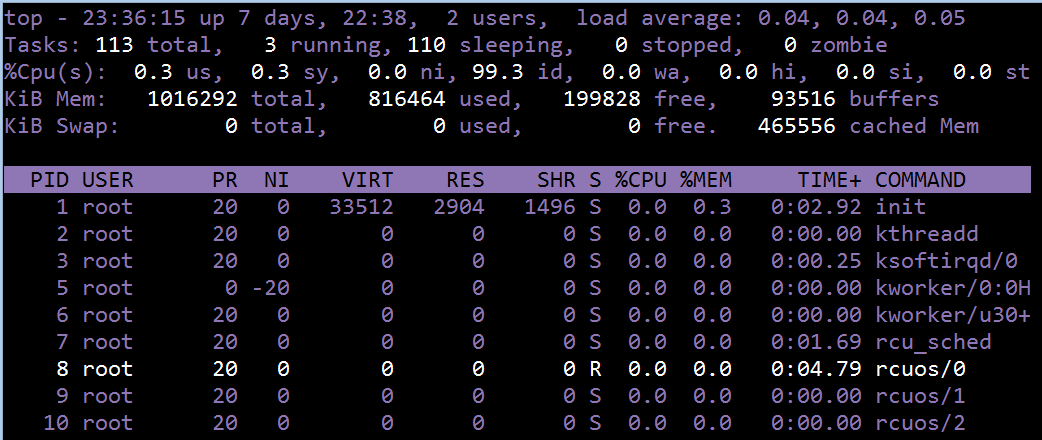
Cloud server:
Test
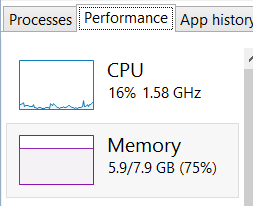
local machine:
jmeter:
Cloud server:
We can see that neither local machine or cloud server is not running out of resources. The network is so poor….
Result
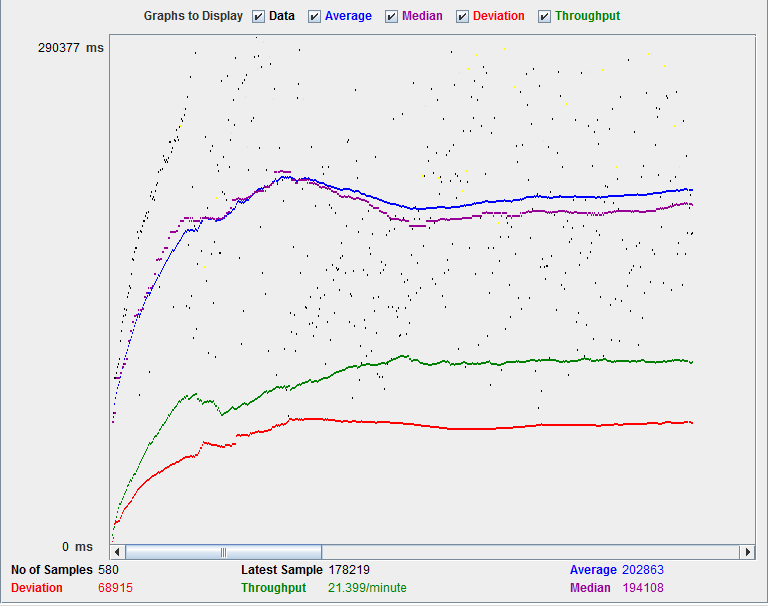
Because of the poor network, the test last so lang and the response time seem to be so lagrge because of network lantency.
When I do the test locally, which means to test the load on the virtual server in Vmware, 2GB java heap can only consume less than 100 users, and only consume less than 25% CPU usage of the virtual server.
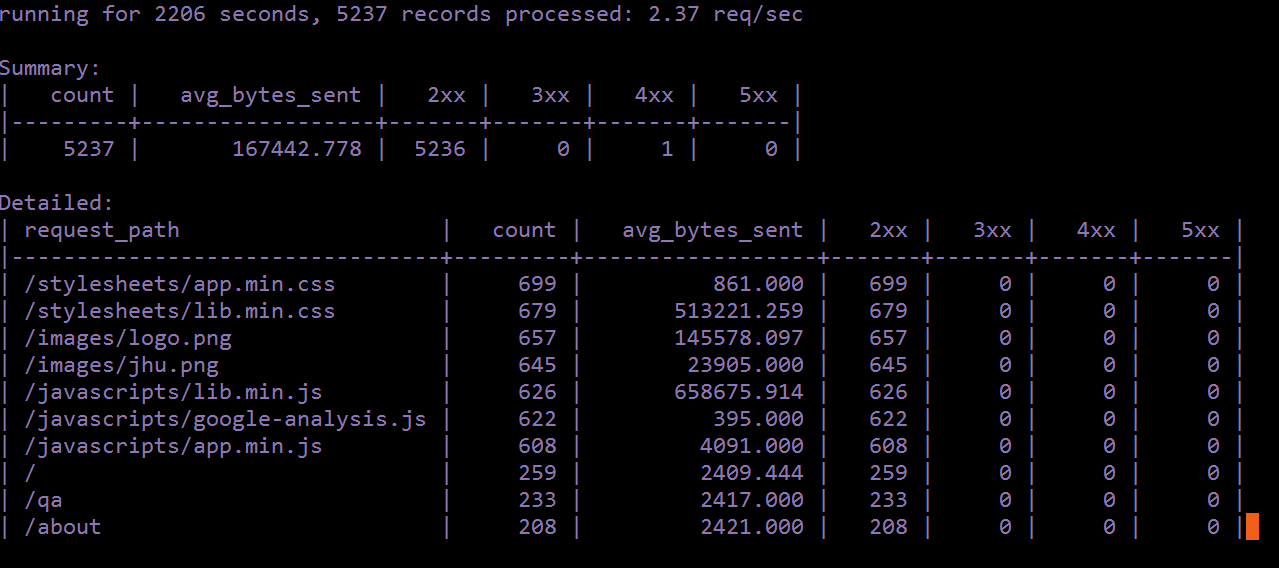
It is said that node.js is the right one who solves the C10K problem. Local experiment can only achieve a peak of 30 RPS. So with current devices, maybe I cannot test the boundry of nodejs.
